A day trading strategy defines when you open and close a position within a trading day. It includes the instrument, session, entry, position size, exit and conditions under which you do not trade.
“Buy when the price rises” is not enough. Rules need to be clear enough to apply before a decision and check afterwards. If you are new to execution, start with the anatomy of a trade.
Five approaches compared
| Approach | Idea | Main risk to examine |
|---|---|---|
| Breakout | Price leaves a predefined range | False breaks and poor execution |
| Trend-following pullback | Enter after a correction in the trend's direction | The pullback becomes a reversal |
| Momentum | Participate in an already strong move | Entering late after an extended move |
| Scalping | Take very short trades on small price changes | Costs and execution errors consume the available margin |
| Reversal / mean reversion | Price returns towards a defined reference | An apparent extreme becomes a persistent trend |
These are families of ideas, not validated trading systems. Two traders can mean very different things by “breakout”. The table does not establish a profitable edge for any approach.
The rules every strategy needs
Write down:
- Instrument and session: what will you observe, and when?
- Setup: which conditions must already be present?
- Trigger: what exactly initiates entry?
- Invalidation and size: where do you exit an adverse move, and how large can the position be?
- Profit and time exits: how do you handle a favourable move, and when must an open position close?
- Exclusions: when do a wide spread, scheduled event or daily limit prevent entry?
A chart formation can be part of those rules. The chart-pattern guide explains why a shape alone is not a complete strategy.
A breakout example, from observation to plan
We use an invented share price without leverage. This is a teaching model, not a signal or a tested system. Euros are the example currency.
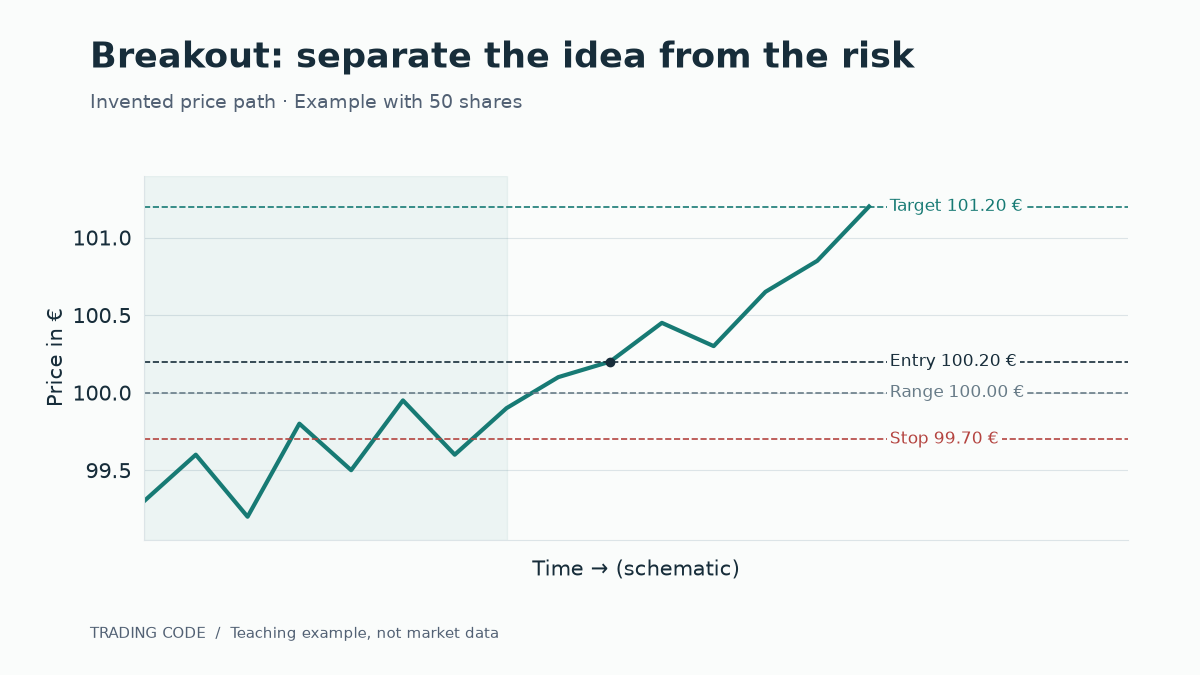
During a predefined observation period, price stays between €99 and €100. Our example waits until a five-minute candle closes above €100 before considering entry. Suppose the subsequent order fills at €100.20.
Entry and position size
The example places a stop at €99.70 and uses a €30 loss budget, including an assumed €5 cost allowance. The price distance is €0.50 per share.
(€30 − €5) ÷ €0.50 = 50 shares.
The position value is €5,010. That is distinct from planned loss exposure. An unleveraged purchase needs the required cash available. The position-sizing example in our trading checklist explores this distinction.
Exits and costs
The illustrative target is €101.20. If reached and filled there, the price gain is 50 × €1 = €50. With €5 total costs, €45 remains before tax. At the stop, the planned price loss is €25, or €30 with the same cost assumption.
A €50 potential price gain against €25 price risk is 2:1 before costs. After the assumed costs, €45 against €30 is 1.5:1. A favourable ratio does not establish positive expectancy: the frequency of outcomes and actual execution prices matter too.
Our time-exit rule closes any remaining position before the chosen session ends. A testable version must specify the exact time and how it handles trading halts.
What if the breakout fails?
Price may return inside the range and trigger the stop. A gap can also produce a worse fill. The planned €30 is therefore not a guaranteed maximum loss. A stop-limit order is not a universal solution: its limit can leave it unfilled.
Trend-following and momentum
A trend-following pullback approach waits for a correction within a defined trend. Momentum looks for a strong move already in progress. Both require measurable criteria: how you identify the trend, how deep a pullback may be and when entry is too late.
Do not substitute “it has risen, so it must keep rising” for a trading hypothesis. In thinly traded instruments, promoted price jumps can be part of a pump-and-dump scheme.
Why scalping is demanding
Scalping uses small intended moves and frequent decisions. Spread, fees, latency and execution quality therefore become especially important. A short holding period does not automatically make trading low-risk or easy.
A visible move on a chart is not the same as an achievable net result. A backtest that fills every order at the desired price can be particularly misleading here.
Reversal and pivot points
Mean reversion assumes a return towards a defined reference. Specify both that reference and when to abandon the idea. “It has already fallen a lot” is not enough reason to buy.
A classic pivot point is (previous session's high + low + close) ÷ 3. It is a calculated reference, not a promise of a turning point. Your data source must make the relevant session and closing price clear.
How to test a strategy
- Freeze the rules before evaluating results.
- Record every qualifying setup in the selected period, including losers.
- Account for available order types, fees, spread and plausible slippage.
- Examine losing streaks, maximum drawdown, average gains and losses, and rule breaches.
- Test a different period that was not used to choose the rules.
- Practise execution in a demo account before deciding whether to risk money.
A handful of selected charts cannot establish profitability. Historical testing also leaves future conditions uncertain. A useful test may reveal that an idea is ambiguous or fails after realistic costs.
Continue learning
Start with one explicit strategy and a journal. The Trading Code book page describes a structured route through systematic trading. Use the beginner checklist to turn the learning into a repeatable routine.
Further reading
All example prices and outcomes were constructed for this explanation.